

Wildlife & Environmental Contaminants Mapper Help
Introduction
The "Wildlife & Environmental Contaminants Mapper" (or just mapper) allows you to display the locations of over 100,000 samples from the "Environmental Contaminants Database Management System" (ECDMS). While the mapper is easy to use, there are a few key concepts you should be aware before you begin to ensure that you use it properly and interpret the data correctly. Therefore, if you are new to the Wildlife & Environmental Contaminants Mapper, we encourage you to read the following sections below listed under the heading "Key Concepts and Important Information".
- Which ECDMS Samples are Mapped and Which are Not
- What Each Mapped Sample Location Represents
- When Will New ECDMS Samples be Mapped
- Map Panning Limits East and West
- Wildlife & Environmental Contaminants Mapper Does Include Analytical Results
- Use of Unexpected Common Names
Key Features and Capabilities of the Wildlife & Environmental Contaminants Mapper
- The mapper allows you to display distinct sample locations for over 100,000 samples from the ECDMS database. For a description of what a "distinct sample locations" means, which is an important concept in the mapper, see the section "What Each Mapped Sample Location Represents" below.
- It allows you to map sample locations using a "clustered view", a "distributed view", or both at the same time. The "clustered view" works best when you want you are interested in a small area, or when you want to interact with the sample locations and display additional information. The "distributed view", as its name implies, works best when you want to see how the samples are distributed over a large, or specific area.
- The mapper allows you to determine which sample locations to display by using "filters". For example, if you only want to see those sample locations associated with Bald Eagle avian egg samples analyzed for mercury or methyl mercury, you can do that with filters. Currently the Wildlife & Environmental Contaminants Mapper includes the following filters, and we hope to add more in the future.
- Species Category
- Species Name
- Analyte Category
- Analyte Name
- Sample Matrix Category
- Sample Matrix
- FWS Refuge Name
- On/Off Refuge Projects
- Catalog Number
- The mapper allows you to select a single sample location and display an "Information Window" in order to get additional information about the site from the ECDMS database. The information window also includes additional links that allows you to generate various ECDMS reports to get even more information about the sample location and catalog.
- The mapper also includes the ability to display three other types of maps (map "layers") in addition to ECDMS sample locations. Currently the map layers available include:
- FWS Refuge boundaries
- Watershed boundaries
- Streams and water bodies
- It allows you to view the Wildlife & Environmental Contaminants Mapper using a satellite view or a street map view, and you can easily switch from one to the other, as needed.
- Includes typical map controls to zoom in and out, full screen mode, return to the default view, and more.
Introduction to ECDMS
For those of you who are not familiar with ECDMS, a brief introduction is provided below. However, you do not need to know anything about ECDMS to successfully use the Wildlife & Environmental Contaminants Mapper. But just in case you are interested, read on.
ECDMS is managed by personnel at the Analytical Control Facility (ACF), which is a branch in the Ecological Services Division of the U.S. Fish and Wildlife Service (FWS). ECDMS is a Web based application that is part of the Environmental Conservation Online System (ECOS) suite of applications used by the FWS. ECDMS is used to store biological, geographic, chemical analysis, and administrative data from samples collected from around the country to assess environmental pollution. It allows Environmental Contaminants Biologists, other FWS personnel, and other Department of the Interior Bureaus to both store and access contaminant data on fish and wildlife and their supporting habitats. In addition, ECDMS provides an array of tools, functions, and features which link the biologist with the administrators, quality assurance officers, and laboratories that perform the chemical analyses.
ECDMS has been operational since March 1991. As of October 2013, the ECDMS database contains sample and analytical results information for over 112,000 samples, and normally adds an additional 2,000 samples per year. The data represents 852 different species and 1,304 different analytes. Samples have been submitted from all 50 states, including the District of Columbia and Puerto Rico, and from 305 FWS refuges. ECDMS even has samples collected from Mexico, Canada, Russia, and the Bering Straits. To date, ECDMS includes almost 3 million reported concentrations from sample analyses.
For More Information or Additional Help
If you cannot find what you are looking for in the Wildlife & Environmental Contaminants Mapper help, or have additional questions about ECDMS or ACF, please contact one the ECDMS system managers listed below and they will be glad to help you:
Name | Phone Number | Email Address |
Danunetta Jones | 703-358-1933 | danunetta_jones@fws.gov |
Key Concepts and Important Information
Which ECDMS Samples are Mapped and Which are Not
Even though ECDMS contains over 115,000 samples (as of October 2013), only about 98,000 of them will be used in the Wildlife & Environmental Contaminants Mapper. The other 17,000 will not be mapped for various reasons, as described below.
- Unsubmitted Catalogs and Samples – Only samples associated with "submitted" catalogs that have been approved by their Regional Coordinator will be included in the Wildlife & Environmental Contaminants Mapper. Catalogs and samples that have not yet been submitted for processing are not yet considered to be a permanent part of the ECDMS database, since they can still be modified or deleted. Currently, ECDMS includes 2,790 samples associated with unsubmitted catalogs.
- Locked Catalogs and Samples – Catalogs and samples that have been permanently locked in ECDMS by a Regional Coordinator will not be mapped, unless they are unlocked at a later date. Typically, catalog and samples that are permanently locked are those that are, or may be, involved in some type of litigation. Currently, ECDMS includes 12,777 locked samples that will not be mapped.
- Samples Without Coordinate Information – ECDMS includes almost 8,000 samples where the catalog submitter did not include any sample location coordinates (latitude/longitude). However, most of these samples will still be mapped by deriving a latitude/longitude from the other sample location included in the sample. For these samples, the Wildlife & Environmental Contaminants Mapper will map a central location based on the state, county, watershed, and FWS refuge information included.
- Samples Without Any Location Information – There are a small number of samples (312) that do not include any coordinates or any sample location information. These samples will not be mapped since there is no information to allow us to do so. Many of the samples are specialty samples associated with the QA/QC of the analytical results. In some cases the analytical lab doing the sample analyses included the sample.
- ACF Check Sample Catalogs – Catalogs and samples used by ACF to determine the quality of each of its contract labs will also not be mapped. Most of these samples were created by ACF staff and do not include any sample coordinates or sample location information.
What Each Mapped Sample Location Represents
As we indicated above, there are over 100,000 samples in the ECDMS database. However, the Wildlife & Environmental Contaminants Mapper does not attempt to map each and every individual sample. Instead, it maps distinct sample locations. As a result, each mapped location might consist of a single sample, or it could represent 5, 10, 20, or even more samples, depending on the nature of the samples and the information provided by the catalog submitter.
What is a distinct sample location in the Wildlife & Environmental Contaminants Mapper? The Wildlife & Environmental Contaminants Mapper determines distinct sample locations based on the following fields and information.
- Catalog Number
- Species Name (for tissue samples)
- Sample Matrix Category (Animal Tissue, Plant Tissue, Soil/Sediment, Water, Other)
- Sample Coordinates
So for example, if catalog "9080060" includes two samples from different species that were collected at the same location, each sample will be mapped separately, since the species names are different. However, if catalog "9080060" includes 20 samples, all from the same species, the same matrix category, and the same coordinates, then only one mapped location will be displayed in the Wildlife & Environmental Contaminants Mapper to represent all 20 samples. You can determine the number of samples associated with each mapped point by displaying its information window, which is described later in this document.
Why Map "Distinct Sample Locations"
There are two primary reasons for why we decided to map distinct sample locations, rather than individual sample in ECDMS.
- Response Time – One of the primary reasons for mapping distinct sample locations is response time. We wanted to ensure that the Wildlife & Environmental Contaminants Mapper was responsive so users would not have to wait several minutes for something to display. By mapping distinct sample locations, rather than individual samples, the total amount of data that the mapper has to process has been greatly reduced.
- The Nature of the ECDMS Data – The response time of the mapper was not the only reason for mapping distinct sample locations, rather than individual samples. In many of the ECDMS catalogs, it is fairly common for the submitter to include the same sample coordinates for a large number of the samples included, and sometimes for all of the samples. Rather than try and figure out a way to display all the overlapping samples (which could be done), we thought a better approach was to display a single mapped location for these types of samples.
When Will New ECDMS Samples be Mapped
Because of the large number of samples in ECDMS, and the amount of data being utilized by the Wildlife & Environmental Contaminants Mapper, the information displayed is not real time, at least not 100%. The Wildlife & Environmental Contaminants Mapper preprocesses some of the data ahead of time, in order to be more responsive when it is used. The preprocessing of data is done nightly, so if someone makes a change to their sample data in ECDMS, or a new catalog is submitted and approved, it will not show up in the ECDMS mapper until the following day.
The preprocessing of the ECDMS data by the mapper does not take very long, just a few minutes; therefore, if needed we could have the mapper preprocess the ECDMS data more often, either several times a day, every hour, or whatever is needed. For now however, we felt that daily was adequate.
Map Panning Limits East and West
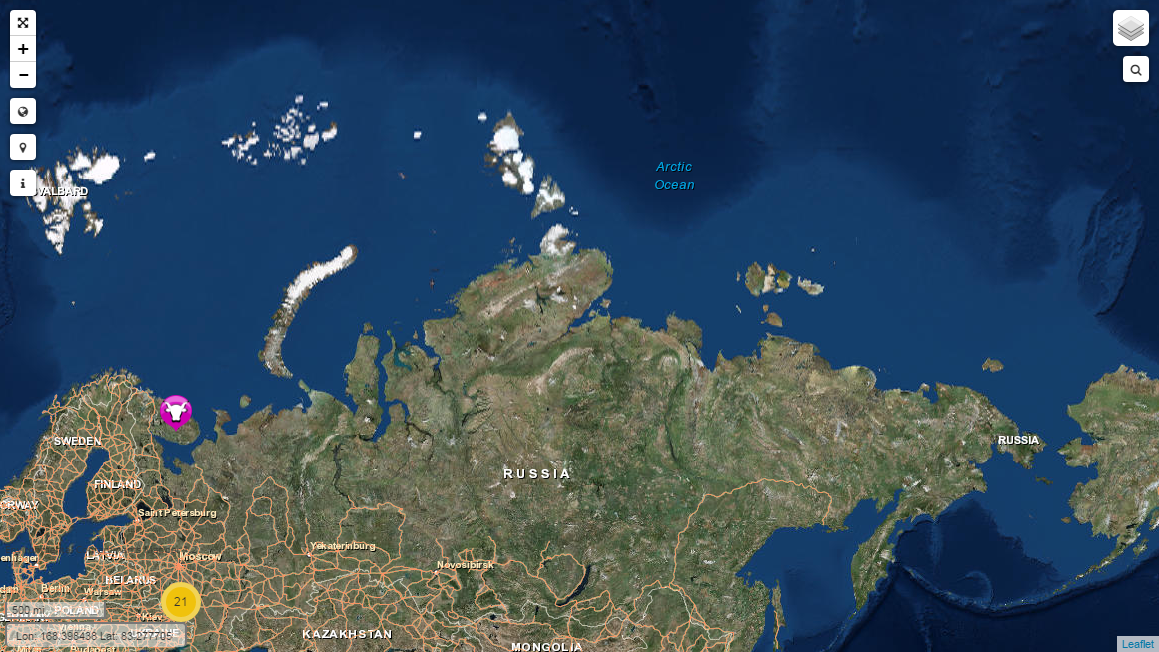
There are limits as to how far you can pan both east and west when using the Wildlife & Environmental Contaminants Mapper that you should be aware of. When moving west, you can only go as far as western Russia and Japan. When moving east, it's the same limit, which is appropriately 140 degrees longitude. Once you reach this limit, the mapper will not permit you to pan any farther, even though the map appears to continue. If you try, the Wildlife & Environmental Contaminants Mapper will simply "bounce" you back. So for example, if you want to view western Russia, pan west until to get to the area you are interested in. If you want to view eastern or central Russia, pan east instead.
The screenshot below shows the appropriate limit to panning east and west (shown by the red line). Note that even though the mapper allows you view a little further east or west, depending on the direction you are panning, no samples will be shown beyond the red line. To see any samples displayed on the other side of the red line, you will have to pan in the opposite direction until you reach the same area from the other side.
The reason we choose that delineation shown below is to ensure that you could see all those samples collected in Alaska along the Aleutian Islands, and those collected in the Bering Sea and western Russia that are in ECDMS. There are also samples collected in eastern Russia that will require you to pan east to see.
Screenshot: 1 – Panning limits east and west.
Wildlife & Environmental Contaminants Mapper Does Include Analytical Results
The Wildlife & Environmental Contaminants Mapper allows you to visually determine where samples were collected and analyzed for environmental contaminants. At this time, there is a way to select a sample location and display the analytical results associated with it. For now you will have to contact ACF for bulk results.
ACF can provide you with the results from any catalog, sample, sample location, or perform a special query. For example, if you want all the mercury and methyl mercury results from Bald Eagle avian egg samples, ACF can provide you with the analytical results, along with the sample information. To make such a request, simply contact one of the ECDMS system managers listed above under "For More Information or Additional Help. ACF can normally get you your data, in whatever format you need, within 48 hours.
When a location that has been identified was part of a Contaminants Investigation where a Final Report was generated, a link to that report will appear. That report will be accessible to a user.
Use of Unexpected Common Names
One of the features included in the Wildlife & Environmental Contaminants Mapper is the ability to display sample locations by various filters (this is discussed in greater detail, later in this document). One of the filters available is species common name. However, for some species, the common name included in the mapper may not be what you would expect to find. To ensure you make full use of the species filter and find what you are looking for, please read on.
In developing the Wildlife & Environmental Contaminants Mapper we also modified ECDMS so that it now uses the taxonomical information maintained by ECOS, which is also used by most of their other Web applications. Up until now, ECDMS had its own somewhat limited taxonomical database which was rarely updated. The taxonomical information used by ECOS comes from the "Integrated Taxonomic Information System (ITIS), which is extensive (ITIS is maintained by the USGS). However, some of the common names that ECOS have adopted may not be obvious when using the Wildlife & Environmental Contaminants Mapper. Some examples are listed below. Therefore, if you are using the species filter and cannot find what you are looking for based on the common name, try using the scientific name, if possible. Both are listed in the species filter and you can search by both.
Common Name | ECOS, ECDMS, & ECDMS Mapper Common Name |
|---|---|
Moose | Eurasian Elk (Alces alces) |
Caribou | Reindeer (Rangifer tarandus) |
Muskrat | Muskbeaver (Ondatra zibethicus) |
Green Winged Teal | Eurasian Teal (Anas crecca) |
Yellow-billed Loon | White-billed Diver (Gavia adamsii) |
Northern Loon | Great Northern Diver (Gavia immer) |
Pacific Loon | Pacific Diver (Gavia pacifica) |
Red-throated Loon | Red-throated Diver (Gavia stellata) |
Black-Necked Stilt | Ae'o (Himantopus mexicanus) |
Atlantic Herring | Baltic Herring (Clupea harengus) |
White Herring | Kyah Alosa pseudoharengus) |
Blue Crab | Bluepoint (Callinectes sapidus) |
What Internet Browser to Use
You can use any of the internet browsers listed below to access the Wildlife & Environmental Contaminants Mapper. Others browsers may work as well, but only those listed below have been fully tested. Of the three, "Google Chrome" and "Microsoft Internet Explorer" appear to run a bit faster than "Firefox", but this may also depend on your internet speed, how you connect to the internet, and your internet provider.
- Google Chrome
- Mozilla Firefox
- Microsoft Internet Explorer (MIE) version 9 or above. Note that MIE version 8 will only partially work with the Wildlife & Environmental Contaminants Mapper and is not recommended or supported.
Reference Guide
Map Navigation
Use the following map controls, shortcut keys, and your mouse to move around the map.
- Zoom In– Use any of the following.
- Click the mappers "Zoom In" icon (upper left side):

- Move your wheel mouse forward.
- Use the keyboard's plus sign key (+).
- Double click anywhere on the map with our mouse.
- Click the mappers "Zoom In" icon (upper left side):
- Zoom Out– Use any of the following.
- Click the mappers "Zoom Out" icon (upper left side):

- Move your wheel mouse backwards.
- Use the keyboard's minus sign key (-). Note that the minus sign key may not work in all browsers, for example it does not seem to work in Firefox.
- Click the mappers "Zoom Out" icon (upper left side):
- Navigating Left, Right, Up, or Down
- Left click your mouse and while holding it down, move your mouse in the opposite direction of where you want to go.
- Use your keyboard arrow keys to move left, right, up or down.
- Restore the Default Map View
 – Click the default view icon (upper left side). This resets the map to the view that was first displayed when the Wildlife & Environmental Contaminants Mapper was started.
 - Full Screen Mode
 – To view the map without the ECDMS/ECOS header and make full use of your browsers display area, click the mappers "Full Screen Mode" icon (upper left side).
Displaying Information ("Layers") on the Map 
To display information on the map, including the ECDMS sample locations, click the "Display Map Layers" icon (shown above) as described below. You can select and display one or more "layers" at a time, and toggle them on and off as needed.
Which Map View to Use
When using the mapper, you can select from two different map views.
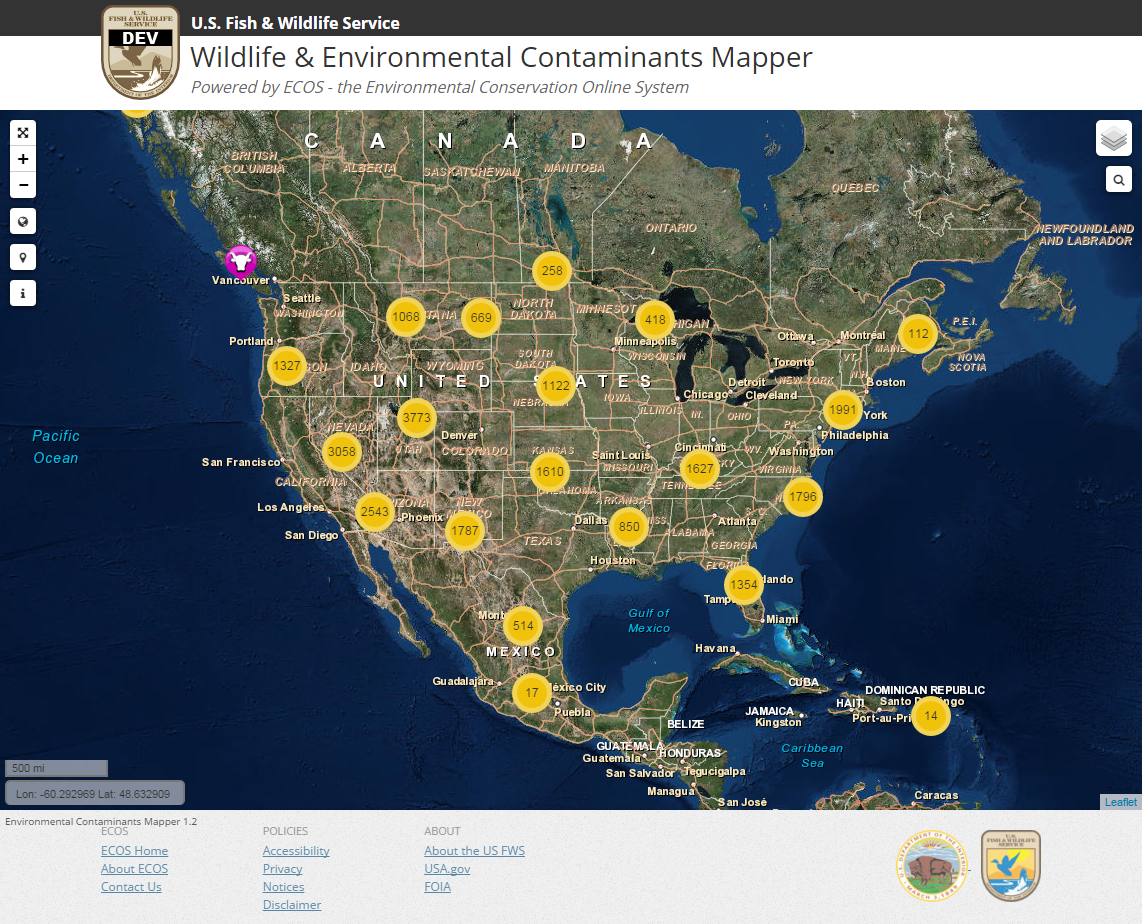
- ESRI Satellite View – This option displays satellite images of the earth. This is the default view when the mapper first starts up, as shown in the example below.
Screenshot: 4 – ESRI Satellite View
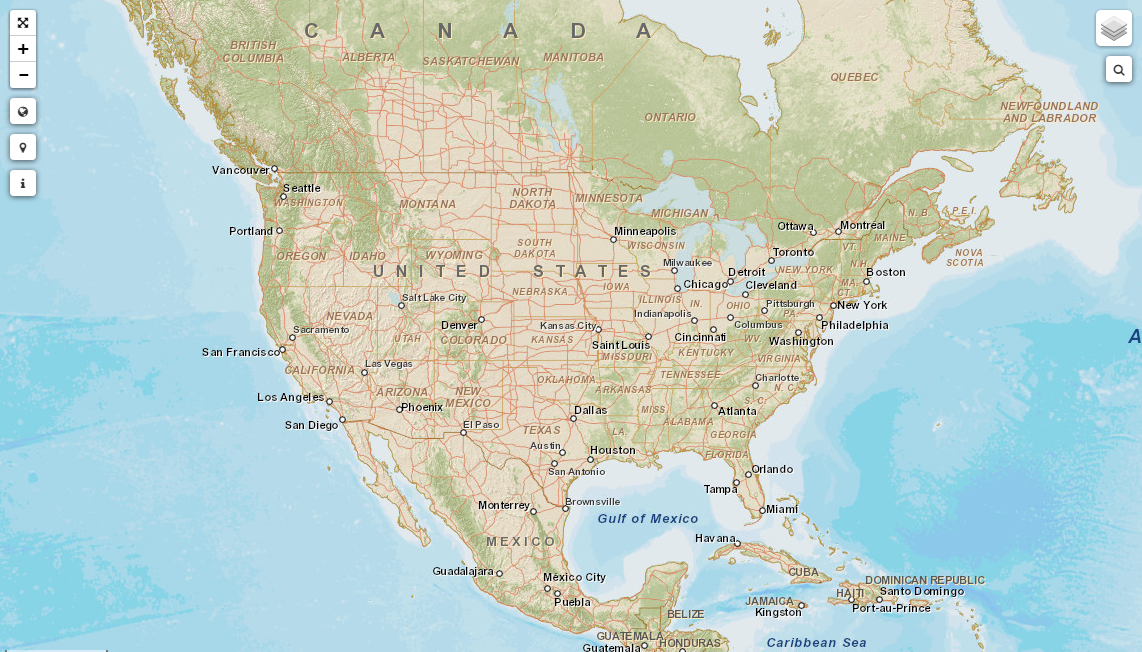
2. ESRI Street Map View – This option allows you to display a street map view in the mapper, as shown in the example below.
Screenshot: 5 – ESRI Street Map View
Map Layers
You can select one or more of the following "layers", in order to display additional information on the map, along with the ECDMS sample locations. You can toggle the "layers" on and off as needed.
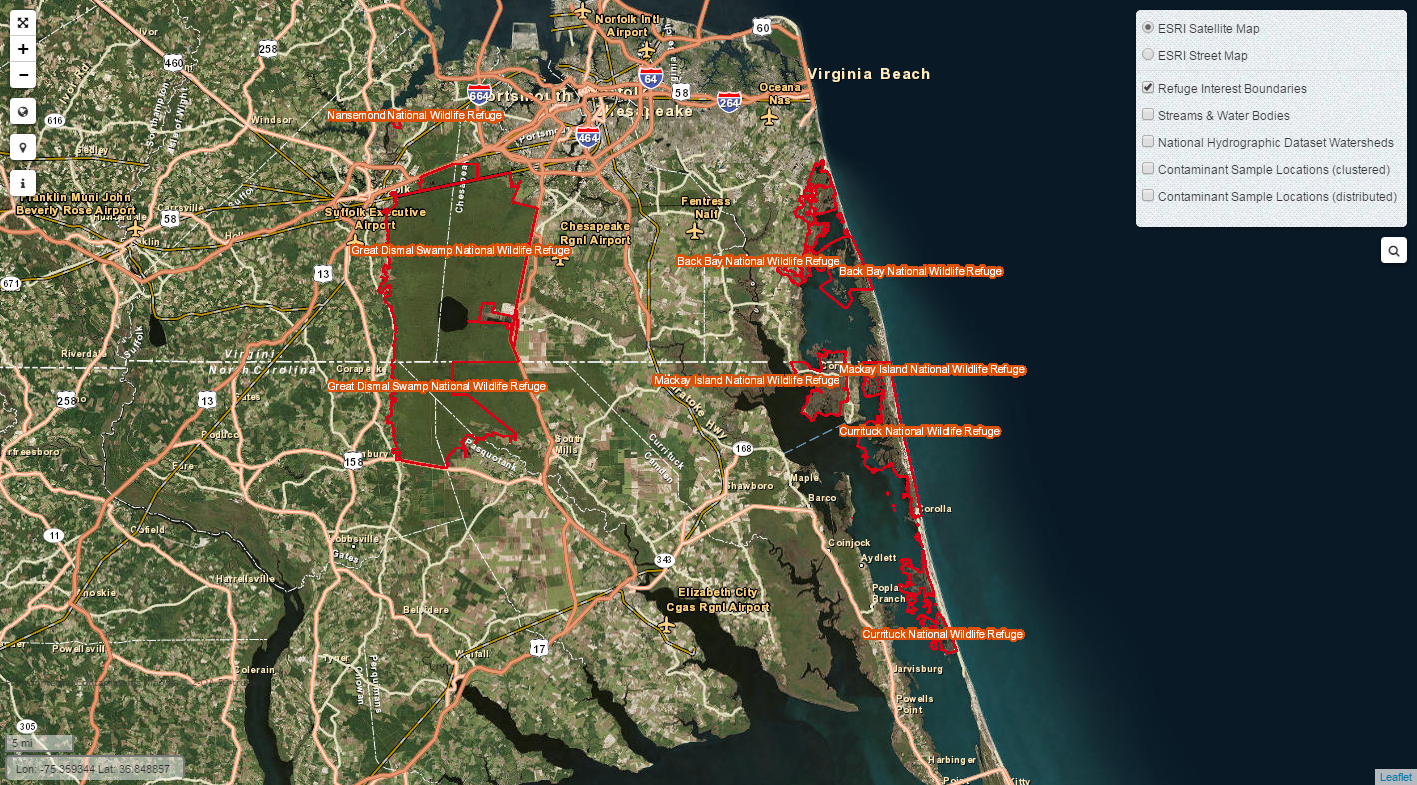
- Refuge Interest Boundaries – This map layer displays the boundaries of all FWS Refuges (shown in red). The name of the refuge is also displayed as you zoom into a specific area. An example is shown below.
Screenshot: 6 – FWS Refuge boundaries (Virginia and North Carolina state boundary south of Virginia Beach)
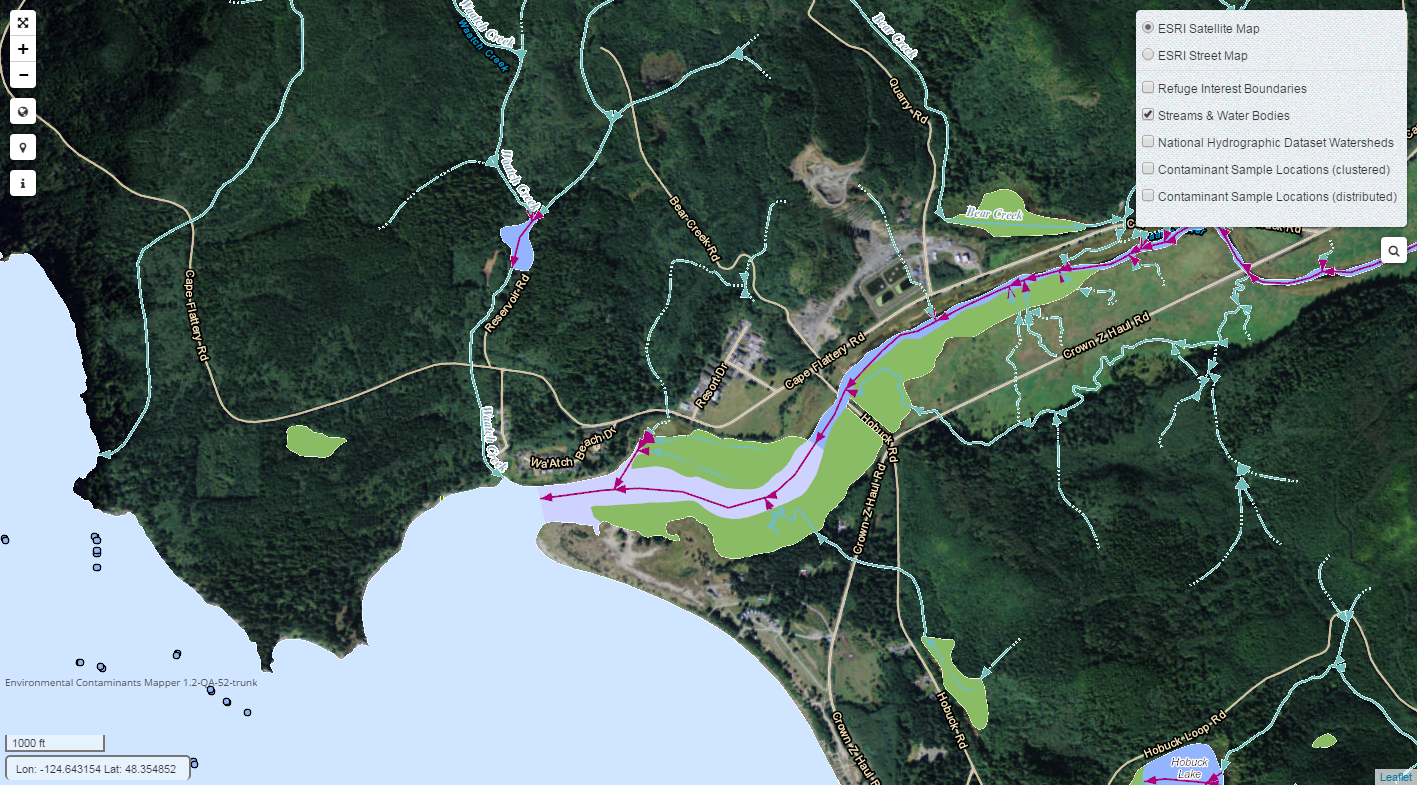
- Streams and Water Bodies – This layer displays all streams, lakes, wetlands, and more for a specific area (in the US and North America only). Because of the amount of data displayed by this layer, the information only becomes visible when you zoom into a specific area sufficiently (an example is shown below). Click the "Display the Map Legend" icon (upper right side) to see a list of the information included in this layer.
Screenshot: 7 – Streams and water bodies (Makah Bay in Washington State)
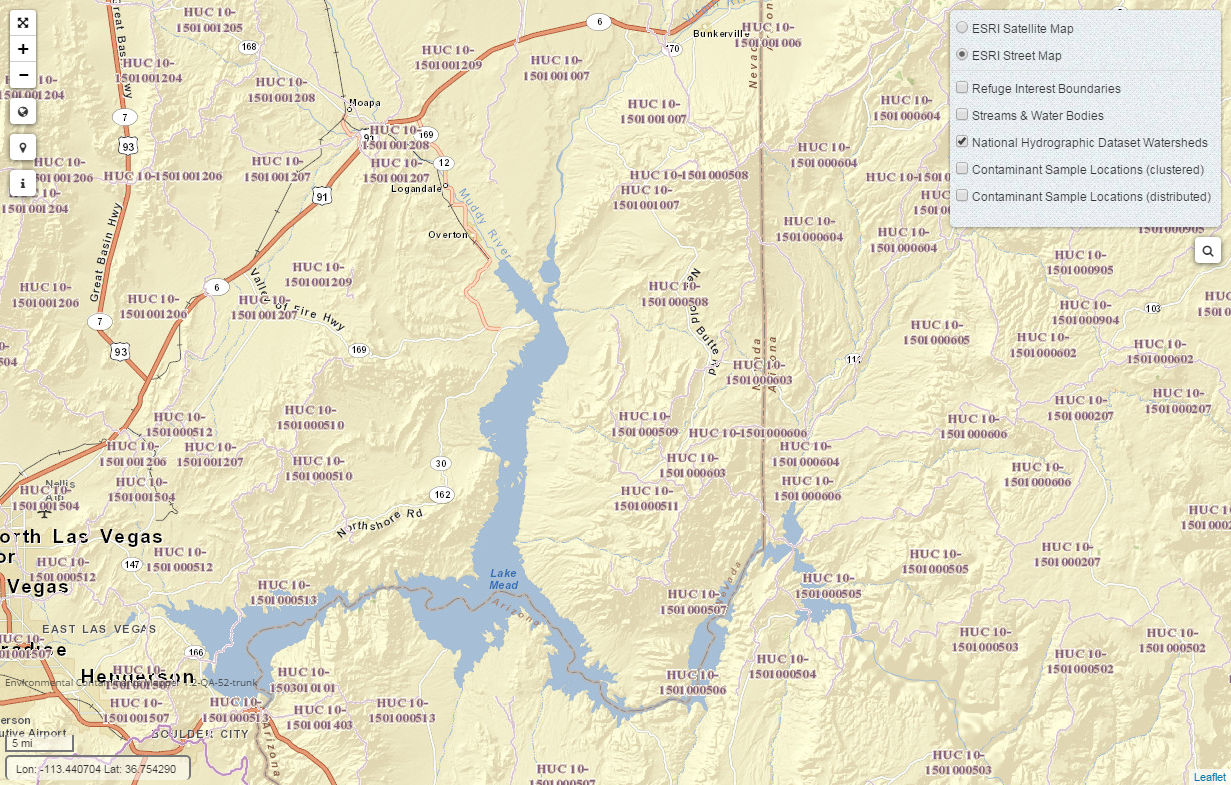
- NHD Watersheds (National Hydrography Data) – This layer displays watershed boundaries (for the US only) and the hydrologic unit code (HUC). As you zoom into an area, the watershed boundaries are further subdivided into smaller hydrologic units. An example is shown below.
Screenshot: 8 - Watersheds boundaries (East of Las Vegas and Lake Mead)
Displaying ECDMS Sample Locations
There are two different ways to display the ECDMS sample locations. Each has its advantages and you can use either one, or both, at the same time. Both can also be used with "filtering" (described later in this section).
"Clustered" ECDMS Sample Locations
This method of displaying the ECDMS samples locations makes it easy to interact with the mapped points and to quickly zoon into a specific area. Initially, when you are zoomed out, the sample locations are "clustered" together, until you zoom in far enough to display individual mapped points.
Overview and How to Use
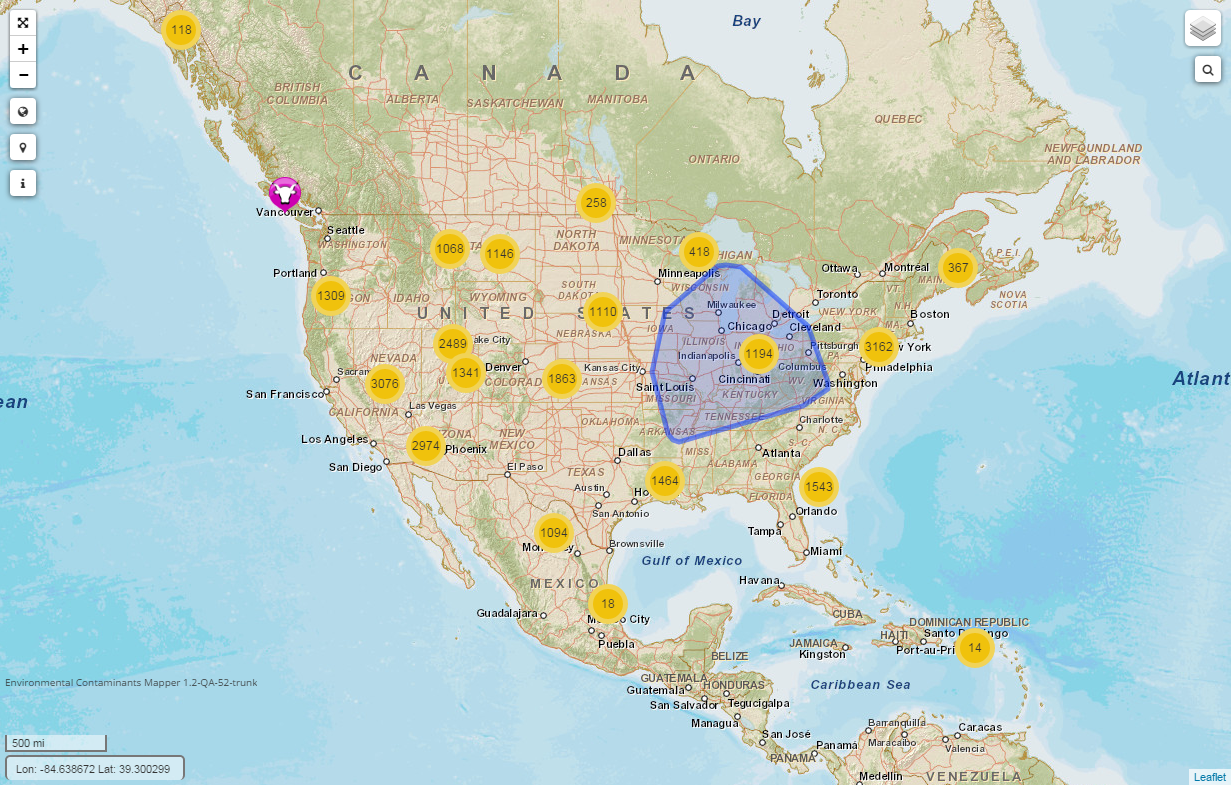
- When you are zoomed out, the mapper uses an algorithm to "cluster" together all nearby sample locations. For an example, see "Screenshot: 9" below.
- Each "cluster" icon includes the number of sample locations that it represents; however, remember these are sample locations, not necessarily individual samples. See the example below.
- When you are zoomed out, the mapper uses an algorithm to "cluster" together all nearby sample locations. For an example, see "Screenshot: 9" below.
Screenshot: 9 – Clustered ECDMS sample locations, all ECDMS samples.

- If you move your cursor over the cluster, the mapper will show you the boarder (in blue) and the defined area that make up each cluster. See the example below.
Screenshot: 10 – Clustered boundary example.
- When you click on one of the cluster icons, the mapper automatically zooms into that area and re-clusters the sample locations, as needed.
- Once you zoom in far enough, the individual sample location icons will be displayed. See the example below.
- When you click on one of the cluster icons, the mapper automatically zooms into that area and re-clusters the sample locations, as needed.
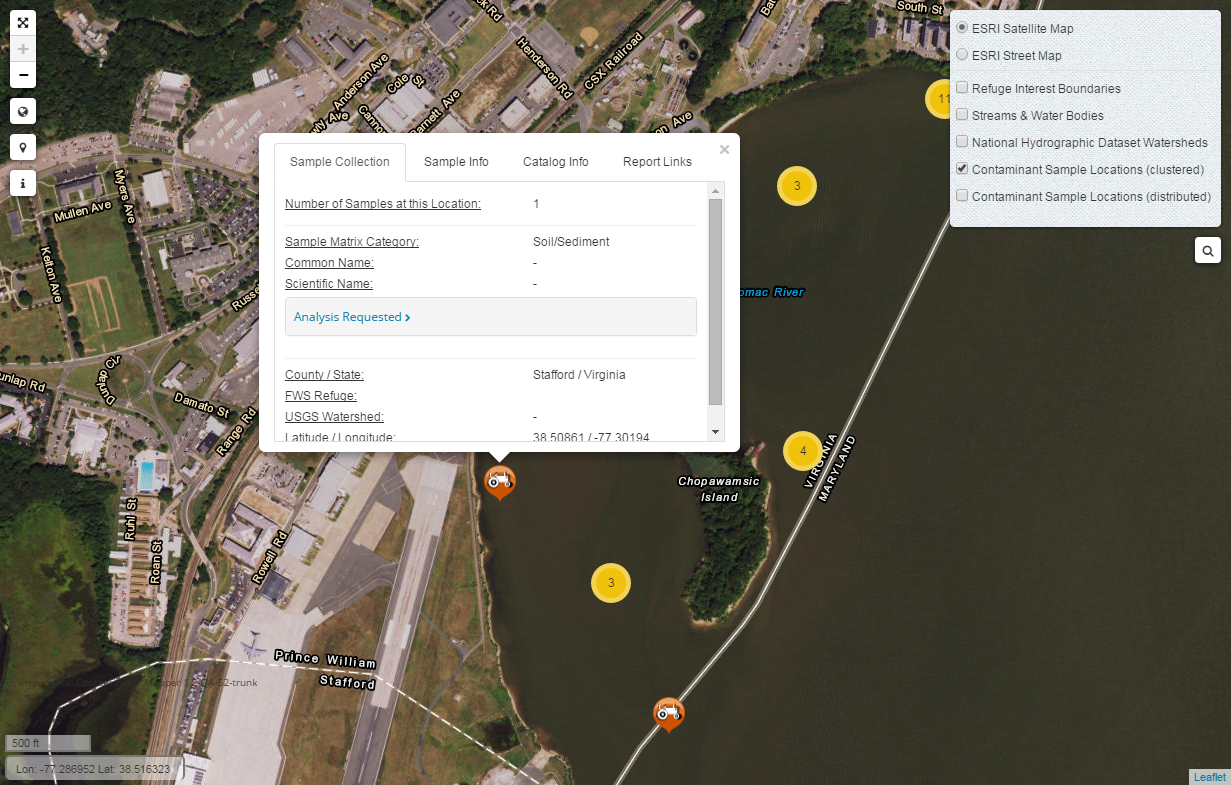
Screenshot: 11 – Individual sample location points and icons (Potomac River in Virginia)
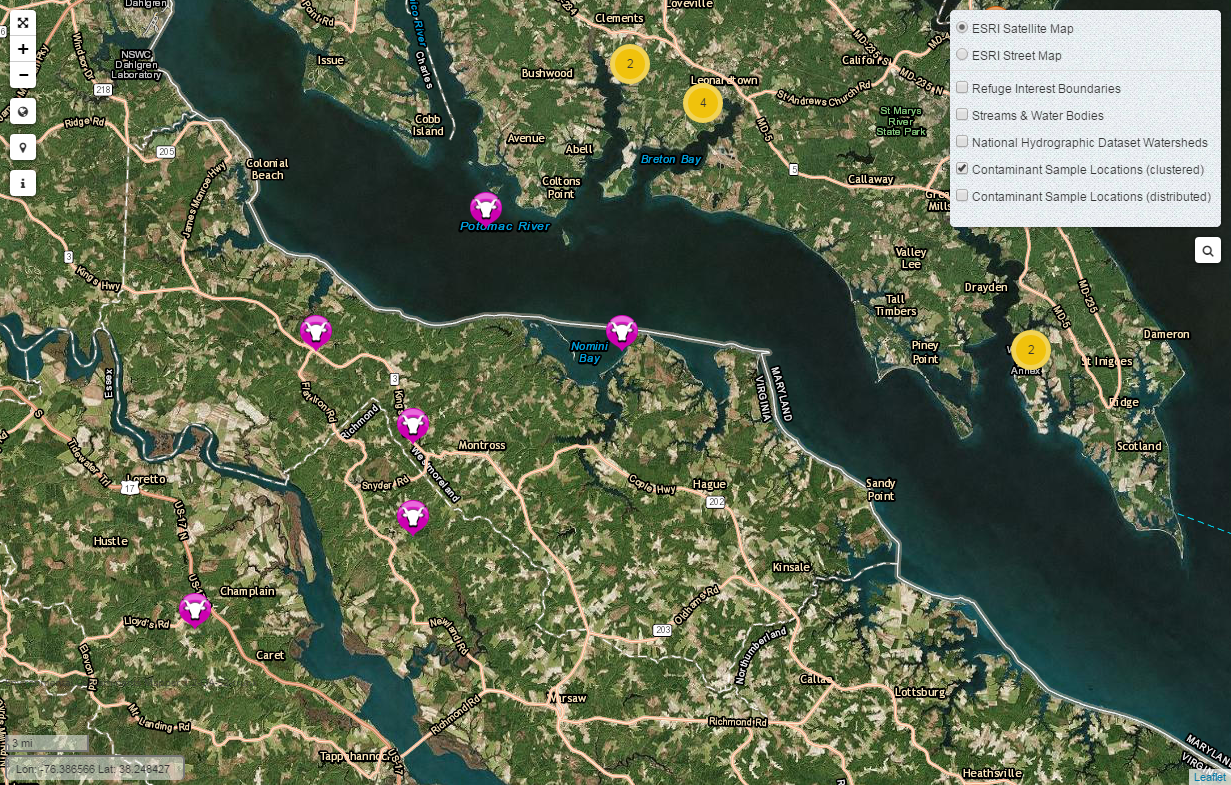
- The icons used for individual sample location are color coded to represent the sample's matrix category, as shown below
| Pink for Animal Tissue |
| Green for Plant Tissue |
| Brown for Soil/Sediment |
| Blue for Water |
| Purple for "Other" (for example, SPMD and other types of filters) |
- Sample locations mapped using coordinates from ECDMS will be round. Those mapped without coordinates, where the sample location was derived from the state, county, watershed, or FWS refuge will be square.
| Example of the icon used for actual coordinates |
| Example of the icon used for derived coordinates |
- Even if a large number of samples were collected at a single location, they will still all be displayed when you zoom in far enough. For a large number of samples in a single area, the sample location icons will be displayed in a circle, like a wagon wheel or pinwheel. See the example below.
Screenshot: 12 – Display of multiple samples collected in a very small area (Quantico Marine base along the Potomac River in Virginia).

- Once the individual sample location icons are displayed, you can click them in order to display an "information" window. The information window displays additional information about the sample location, the samples, and the catalog they are associated with. It also indicates how many samples are associated with the mapped sample location. All the information displayed in the information window comes directly from ECDMS. See the example below.
Screenshot: 13 – Example of the mapper Information Window
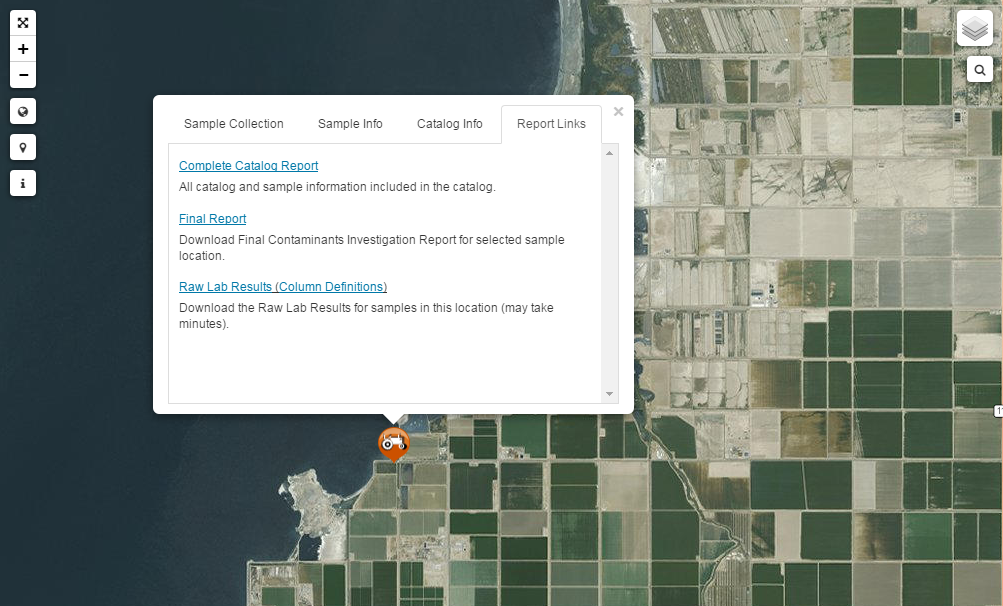
- The information window also includes links that allows you to run two ECDMS reports to get even more information about the samples and catalog associated with a given sample location. The reports included are the "Complete Catalog Report", the "Final Report" (where available) and the "Raw Lab Results" (where available) . See the example below.
Screenshot: 14 – ECDMS Report links in the Information Window
"Distributed" ECDMS Sample Locations
This method of displaying ECDMS sample locations is best for seeing how the samples are spread over a specific area, large or small. However, there are some disadvantages when using this method, when compared to the "clustered" view described above. These are discussed below.
Overview and How to Use
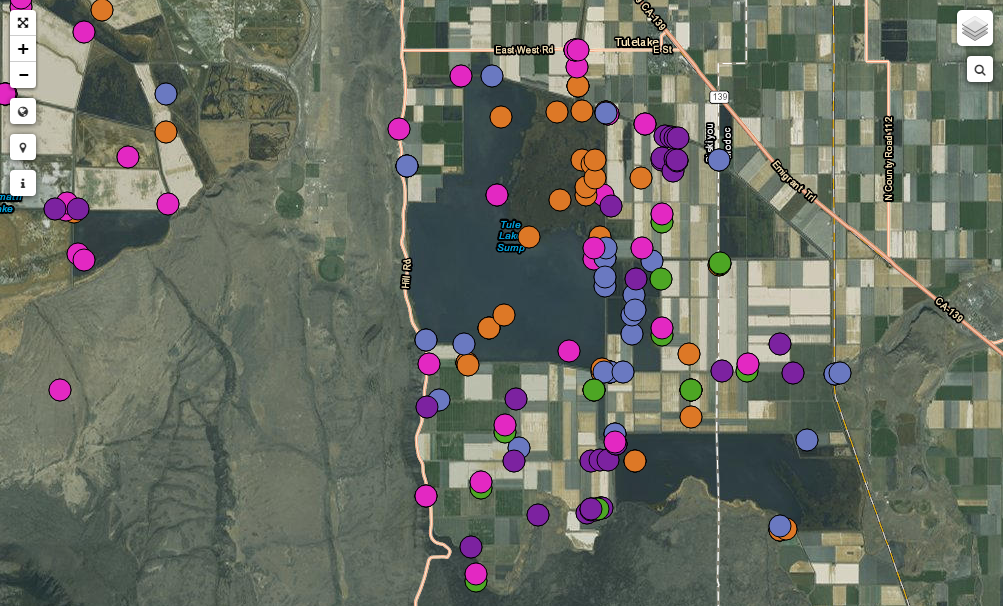
Sample Location Icons- Each sample location is mapped using an appropriate colored icon based on the sample matrix category, as shown below. Also see the screenshot example below.

Pink for Animal Tissue

Green for Plant Tissue

Brown for Soil/Sediment

Blue for Water

Purple for "Other" (for example, for example, SPMD and other types of filters )
Screenshot: 15 - Example of the "distributed" ECDMS sample location map and layer (Tule Lake, northern California)

Round vs. Square Sample Icons- Samples mapped using coordinates from ECDMS will be round. Those sample locations without coordinates, where the location was derived from the state, county, watershed, or FWS refuge will be square.
Example of the icon used for actual coordinates

Example of the icon used for derived coordinates
- You cannot select individual sample locations, as you can with the "clustered" view described above. Therefore, you also cannot display the "information" window available in the "clustered" view.
- Multiple samples collected at the same sample location, or very close together, will appear as a single point in the "distributed" view, no matter how far you zoom in.
- There is no way to determine how many samples are actually represented by each mapped location, unless you turn on and use the "clustered" view.
Using Filters to Display Only What You Want 
If you only want to display certain sample locations, use the mapper's filter option. To do this, select the filter icon (shown above) in the upper left side of the map.
Filters Available – Currently, the following filters are available in the mapper. We hope to add more in the future.
- Species Category – Allows you to display all samples associated with one or more species categories. For example: Birds, Fish, Snails, Flowering Plants, and so forth.
- Species Name – Allows you to filter by one or more specie names. You can search and select a given species by its common name or scientific name.
- Analyte Category – Allows you to display all the samples associated with a given analyte category. For example: all PCB Congeners, all Organochlorines, all Elements, and so forth.
- Analyte Name – Allows you to filter by one or more analyte names. For example: Mercury, Selenium, PCB# 209, o,p'-DDT
- Sample Matrix Category – Allows you to display all the samples associated with a given sample matrix category. For example: Animal Tissue, Plant Tissue, Water, Soil/Sediment, and so forth.
- Sample Matrix – Allows you to filter by one or more specific sample matrices. For example: Avian Egg, Liver, Plasma, Detritus, and so forth.
- Catalog Number – Allows you to map the sample locations associated with one or more ECDMS catalog numbers.
- On/Off Refuge Project ID – Allows you to map all the sample locations associated with an On/Off Refuge project id.
- FWS Refuge Name – Allows you to map all samples collected on one or more FWS Refuges.
- Species Category – Allows you to display all samples associated with one or more species categories. For example: Birds, Fish, Snails, Flowering Plants, and so forth.
Filters Overview and How to Use
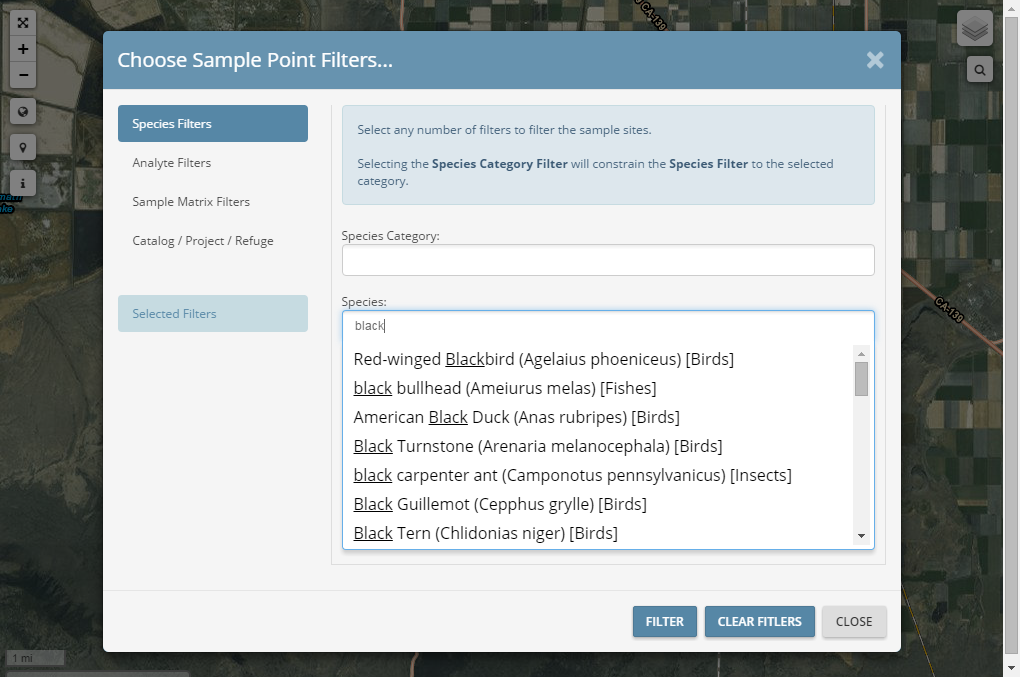
- Typeahead Lookup – Each filter, when selected, includes a typeahead lookup. Just type in part, or all, of the entry you are looking for and all the entries that match what you have entered will be displayed (case does not matter). See the example below where "black" has been entered in the "Species" filter.
Screenshot: 16 – Example of the typeahead filter lookup for species name
- Use Your Mouse and the Scroll Bar – You can also use your wheel mouse and the scroll bar next to the filter lookup to view all the entries listed, either before you use the typeahead lookup or after.
- Some Filters are Linked– The filters listed below are linked together. When you select a given "category", only the members of that "category" will be listed and will be available in the non-category filter. For example, if you select "Birds" in the species category, then only birds will be listed and be available when using the typeahead lookup in the "Species Name" category.
- "Species Category" and "Species Name"
- "Analyte Category" and "Analyte Name"
- "Sample Matrix Category" and "Sample Matrix"
- You Can Select One or More – You can select one or more entries, in one or more of the filters to match what you are looking for. So for example, you could select "Bald Eagle" in the species name filter, "mercury" and "methyl mercury" in the analyte filter, and "Avian Egg" in the sample matrix filter.
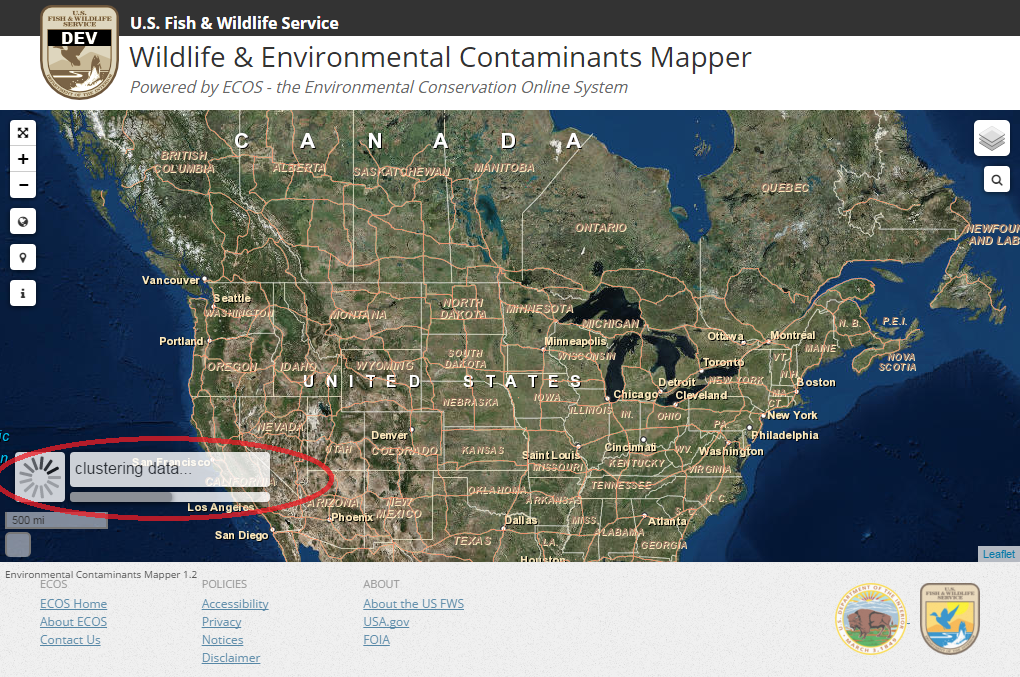
- Filter Button – Once you have entered your filter, click the "Filter" button at the bottom of the screen. This will cause the filter window to close and a "progress" bar will be displayed at the bottom left side of the map to indicate that the mapper is processing your request. See the example below. The progress bar is circled in red. You may have to scroll down to see it depending on your screen size.
- Use Your Mouse and the Scroll Bar – You can also use your wheel mouse and the scroll bar next to the filter lookup to view all the entries listed, either before you use the typeahead lookup or after.
Screenshot: 17 – Example of the "progress" bar, circled in red below.
- IMPORTANT: In order for your filter to take affect and display the sample locations on the map, you must also select one of the following map layers, if you have not already done so.
- ECDMS Sample Locations (clustered)
- ECDMS Sample Locations (distributed)
- There is No Filter Validation – Also keep in mind that there may not be any samples that match your filter request. The mapper does not validate your filter request in any way to ensure it makes sense. So for example, you could select "Bald Eagle" as the species name and "Water" and "Soil/Sediment" as the sample matrix category. The mapper will allow you to do this, but obviously it will not find any Bald Eagle samples with a sample matrix of Water or Soil/Sediment.
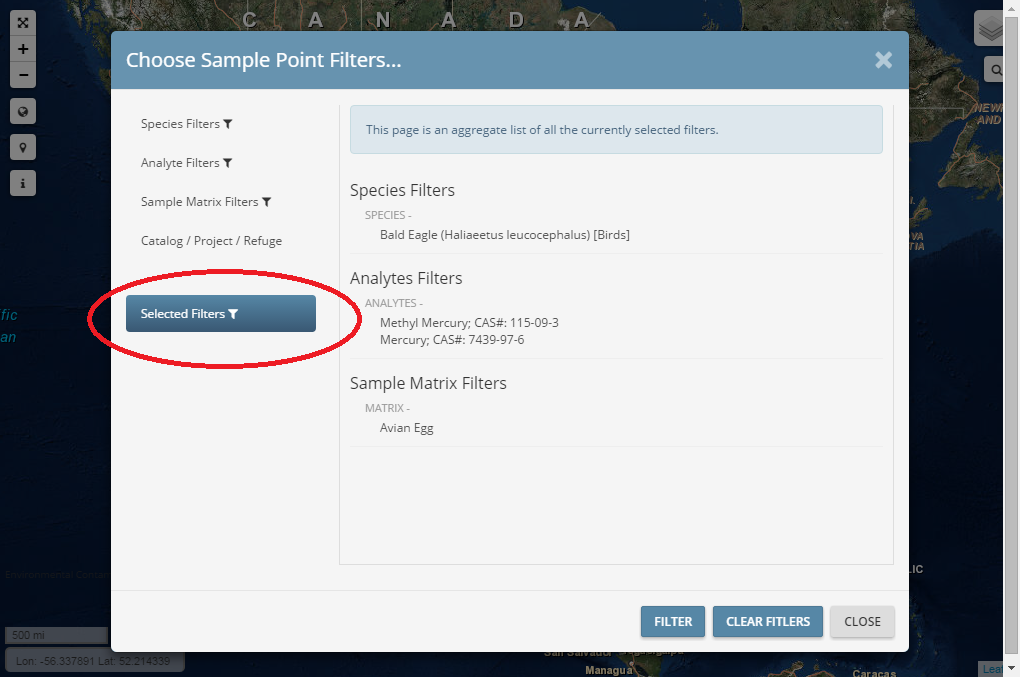
- View Selected Filters – To view what filters you currently have selected, click the "Selected Filters" button (circled in red in the example below) in the filters pop-up window.
- IMPORTANT: In order for your filter to take affect and display the sample locations on the map, you must also select one of the following map layers, if you have not already done so.
Screenshot: 18 – How to view what filters have been selected (circled in red below)
- Clear Filters Button – To clear all filters, simply click the "Clear Filters" button at the bottom of the filter window.
- Filter Indicator – Once you display the sample locations associated with one or more filters, the mappers filter icon changes from to . This is just to remind you that you are using one or more filters to display the current sample locations.
Other Map Controls to be Aware Of
- Display the Map Legend
 – To determine what symbols are used and what each represents, click the map legend icon displayed in the upper left side of the map. An example is shown below.
- Display the Map Legend
Screenshot: 19 - Map Legend with the "ECDMS Distributed Sample Locations" selected

- Help – To display the Wildlife & Environmental Contaminants Mapper help, which includes the document and information you are currently reading, click the "Help" button displayed in the upper left hand side above the map. Note that if you are viewing the mapper in full screen mode, the "Help" button will not be displayed.
- Help – To display the Wildlife & Environmental Contaminants Mapper help, which includes the document and information you are currently reading, click the "Help" button displayed in the upper left hand side above the map. Note that if you are viewing the mapper in full screen mode, the "Help" button will not be displayed.
Known Problems and Limitations in the Wildlife & Environmental Contaminants Mapper
- Initial Display of the Mapper – Sometimes it can take a little time to display the initial default map in the Wildlife & Environmental Contaminants Mapper. Therefore, the first time you access the mapper, in a given session, be patient. It may take 15 – 30 seconds for the initial map to display.
- Analysis Requested – You can display the analysis requested associated with each sample location in the mapper’s “Information Window”. However, for those analyses where the catalog submitter also included a list of analytes or elements (for example, in an ICP Mass Spec, Pharmaceuticals, Speciation, and so forth), they are not included in the analysis requested displayed in the Wildlife & Environmental Contaminants Mapper. To see them, use the link displayed in the “Information Window” to generate the ECDMS “Working Catalog Report”. We planned to include the analytes and elements requested, but ran out of time and money. It will be added sometime in the future.
- Refuge Boundaries – In the Wildlife & Environmental Contaminants Mapper, you also have the ability to display FWS refuge boundaries. However, sometimes displaying the boundaries can be painfully slow, especially in Alaska. The ECOS folks are aware of this and promise to improve its display sometime in the near future. Sometimes displaying of the refuge boundaries can take several minutes.
- Inaccurate Location Data – We know that some of the location data in ECDMS is inaccurate; especially for those data entered before 2002, when there was little validation associated with the location fields in ECDMS. For example, we found several samples being mapped in Greenland because the catalog submitter entered their latitude data in the longitude field and the longitude data in the latitude field (these have been fixed). Whenever a questionable sample location is found, we plan to contact the catalog submitter (if possible) to see if corrected data exists. If it cannot, we have the ability in the Wildlife & Environmental Contaminants Mapper to ignore the sample coordinates and derive the sample location from a central point based on the samples other location data (state, county, FWS refuge, and watershed). Also, the exact locations of some of the data has sometimes been altered to minimize collection of wildlife by outside parties.
